Building Data Analysis
Short Version
We used the ERS data for our buildings to analyze the current district proposal, and found that it is NOT feasible by their own numbers. We are short at minimum 72 classrooms in 15 buildings, with no real feasible way to correct for this. We also used that same dataset to approximate what our proposal would look like, and it is very feasible overall, with only one significant concern to be addressed with a more complete set of data. If you want a lot more detail, read on.
Adapting the Data
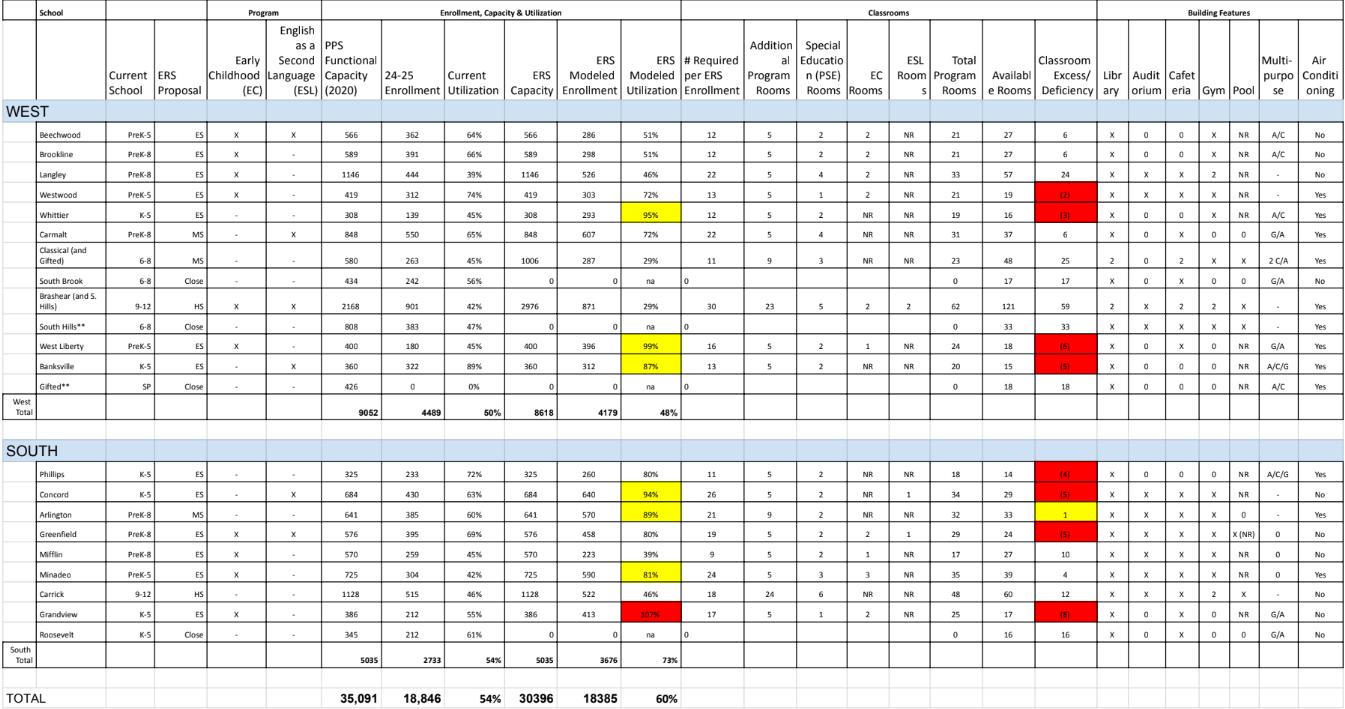
We have produced our own feasibility data based on the most recent data released by the administration. Below you can see aggregated dataset allowing insight into enrollment, needed classrooms, etc.
We created this dataset by taking the PDF files of building data, and working through the process of converting them back to a usable spreadsheet format. We then organized them into one sheet. We organized the schools into the regions according to our model. We can look at the numbers for the current proposal from this organizational point, as it will be the most easily compared to our proposal.
There are a lot of data points, but most can be ignored for this purpose. The main columns we will be looking at both for our proposal and for the current district plan are the ERS Capacity and ERS Modeled Enrollment, from which we calculate ERS Modeled Utilization, plus Total Program Rooms and Available Rooms, from which we calculate Classroom Excess/Deficiency.
Current Proposal NOT Feasible
We can see from this data that the district’s current plan has many schools near or over 100% utilization. 100% Utilization means that every single classroom is at max capacity at all points of the day when it is in use. This is never even close to reality. Anything over about 80% by this metric is too full to be practical in real life. As you can see, 15 of our schools are over this utilization mark in the current proposal. 15 schools also are short on needed classrooms. The proposal is missing 72 classrooms, and these are likely optimistic numbers... The reality is probably worse. The data shows that this proposal is NOT FEASIBLE to even house our current student needs, let alone allow for growth, community engagement, etc. All of this is based on ERS’s recommendations, and does not even factor in the district’s stance that we should NOT reopen Northview (366 modeled enrollment and 31 classrooms - taking the deficiency to well over 100 classrooms in the proposal), and that the Student Achievement Center should be integrated into schools (unknown additional deficiency of classrooms, over-utilization, etc).
Yellow indicates workable, but very much non-ideal conditions. Red is not workable at all without giving up services etc.

More Data Needed
Regarding our proposal, real analysis with a full data set would be necessary to reach full conclusions, but this is a really solid starting point.
Methodology of Data Adaptation
Here’s the concept of how we apply this data to our regions of choice model, shifting it to represent the different buildings that we identified to keep open or close.
The district proposal views (almost) every school as an island - a neighborhood school drawing only from the area around itself. Our proposal is based on regions, and this gives flexibility to adapt enrollment numbers, demographic changes, and distribute resources across a region. The numbers below illustrate a representative comparison of the enrollment utilization and Classroom Excess/Deficiency for the school buildings that will be open in our proposal. If you want more detail, it is explained more fully at the bottom of the page.
Community Proposal Feasible
As we can see in this summary chart, this system produces a very positive outcome.
Most of our schools fall in a good Utilization range - we are targeting 60% - 80%. The main outlier is our High Schools, which are quite low. We advocate bringing community services and the administration’s offices into the schools, so this is an optimal place to utilize that extra capacity.
When considering availability of classrooms in our model, we have enough spare rooms to be flexible and utilize some for community services/administration somewhere in all regions. The Elementary schools in the South region show a deficit. We are unsure how this happened, as it doesn’t seem to make sense with all the other numbers, current utilization of our Elementary schools in that area, etc. We would like to verify that this classroom number is accurate, and then would need to look at solutions. We are only closing one school in that region (to become the Community Hub), so this result is somewhat surprising.
Also note, that while the 5 region totals are provided for Middle and High schools as a reference, our model distributes these needs across the larger regions and the individual regions are not particularly relevant for Middle and High schools - this is why that data is light grey - the more relevant numbers are in black. Yellow highlight indicates a workable condition, but slightly below optimal target. Red indicates a scenario that might not be possible without some changes. We need to look more closely at these once we have better data to work from.

Flexibility and District Control
The regional choice model allows for flexibility to adapt to the ever changing populations, demographics, and needs of our city without having to do another round of extremely disruptive attendance zone and feeder patterns changes. In addition to providing the district with flexibility, there is retention of choice, promotion of equity, allowance for diversity, and structuring of reasonable transportation costs. See our Transportation page for more details.
For the Data Nerds:
There’s a ton of math (formulas in a spreadsheet) that allow us to do this - we total up the modeled enrollment of all ECS Elementary, Middle, and High schools in each region. Because these are all neighborhood schools (with a couple exceptions), we can assume these are kids that would be living in the regions that the schools are located in, and the total of those expected enrollment numbers would be a pretty accurate representation of the expected total enrollment in that same region in our model. We do the same thing with Total Program Rooms, to see how many rooms are needed under this modeling for the entire region.
Then we look at each of our plan’s Elementary, Middle, and High schools, in each region, and add up their ERS Capacity (or we used the older capacity numbers on buildings where ERS number is zero because they had closed that building). This gives us the expected capacity for the region, for each grade level, using our modeled buildings. We do the same thing for Available Rooms in each of our open buildings at each grade level in each region.
Now we can do the math with those numbers to get our modeled utilization - ERS Modeled Enrollment total divided by ERS Capacity gives us Utilization, and Available Rooms divided by Total Program Rooms gives us our Classroom Excess/Deficiency. These numbers are for each region at each grade level.
Our Elementary school model is now in the form that reflects our model. We need to take one more step for Middle and High Schools. We simply add all the data together for High School and recalculate the Utilization and Classroom numbers with these totals. Our Middle school regions require us to add up North, East, and a proportional section of Central for one region, and then South, West, and the corresponding proportional section of Central.
If that’s not enough detail to satisfy your data-nerd ways, reach out to us and we’ll connect you with Mike that put this info together. He’s happy to explain further if needed.